Six-Branch Sales & Inventory Dashboard
Brings every branch's sales, stock and customers onto one screen instead of nine files merged by hand.
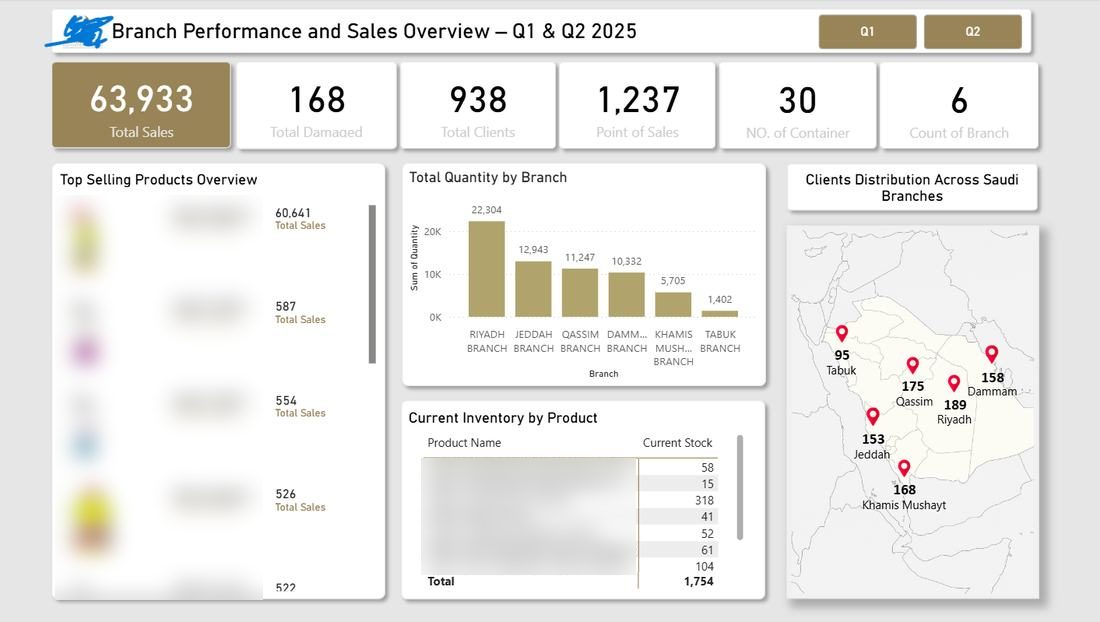
A cleaning-products factory with six branches. H1 2025 unified 63,933 sales.
- My role
- Data modeling and two interactive dashboards
- Platform
- Power BI
- Client
- A cleaning-products factory in Saudi Arabia, products and brand hidden
Explore the work
- Pick Q1 or Q2
- Click a branch to see its products and stock
- Check the items running low
The preview couldn’t load.
A web preview of selected functions with synthetic data and products. The numbers don't represent the client.
The story
Sales, purchases, inventory and shortages lived in separate files per branch. Management merged numbers by hand, and nobody knew which branch actually made money.
Full data modeling, then two interactive Power BI dashboards: KPIs, sales by branch and product, customers' geographic distribution and live inventory.
Six branches on one decision screen. The owner opens a dashboard instead of nine files.
Documented results
Screenshots
Screenshots of the original dashboard with products and brand hidden.